- Theory predicts energies and scalings; the laboratory asks: energy, number, spectrum, species.
- A magnet spectrometer maps momentum \(p/(qB)\) to deflection — but mixes species with the same \(q/m\); filters and CR-39 help break that degeneracy.
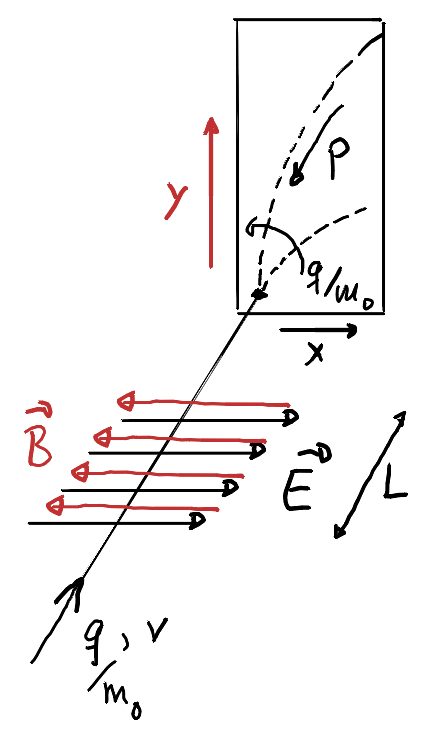
- A Thomson parabola (\(E\parallel B\)) separates charge-to-mass: each species traces \(x\propto y^2\).
- Bethe–Bloch stopping \(-\mathrm{d}E/\mathrm{d}x(E)\) explains filter ranges, CR-39 pit size (local LET), and the Bragg peak — the bridge to Lecture 11.
- Typical laser–ion spectra are broad and roughly exponential with a cut-off \(E_{\max}\).
- Braun tube with magnetic field and scintillator — charged-particle deflection / spectroscopy intuition.
- Braun tube with combined electric and magnetic fields (“oscilloscope”) — \(E\) and \(B\) steering on a screen.
Lectures 1–9 built the physics story: lasers, plasmas, absorption, TNSA and radiation pressure. Models (Mora, Fuchs, Schreiber, light sail) concentrate on predicting maximum energies and how to improve scalings. Today we switch perspective: how do you actually measure what comes out of a laser–plasma experiment? Measurement of ion energy distributions is key both for understanding the acceleration physics and for applications.
1. What to characterize?
A useful experimental report answers at least:
- Energy — especially the cut-off \(E_{\max}\) and, better, the full spectrum;
- Particle number (or fluence) in a given energy band and solid angle;
- Energy distribution \(\mathrm{d}N/\mathrm{d}E\) (or \(\mathrm{d}^3N/\mathrm{d}\Omega\,\mathrm{d}E\));
- Ion species and charge state (\(p\), \(C^{q+}\), …).
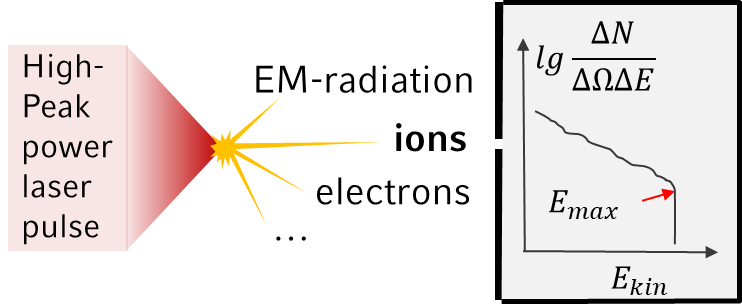
Typical laser–ion spectra look roughly exponential on a log plot and terminate at \(E_{\max}\). That shape already hints at the next block of the course: when such a spectrum enters water, each energy deposits at a different depth — a spread-out Bragg curve (Lecture 11).
2. Magnetic spectrometer
Send a collimated spray through a dipole field \(B\) of length \(L\). The trajectory has curvature radius \[ R = \frac{p}{qB}. \] On a screen a distance \(L_2\) after the magnet, the deflection \(y\) is a monotonic function of \(R\) (hence of momentum per charge). For a magnet that starts at the slit and for geometry with magnet length \(L\), \[ y = R - \sqrt{R^2 - L^2} = R\left(1 - \sqrt{1 - \left(\frac{L}{R}\right)^2}\right) \] (exact chord formula inside the field); including drifts \(L_1\), \(L_2\) generalises this (see Exercise 10). Higher momentum → larger \(R\) → smaller deflection.
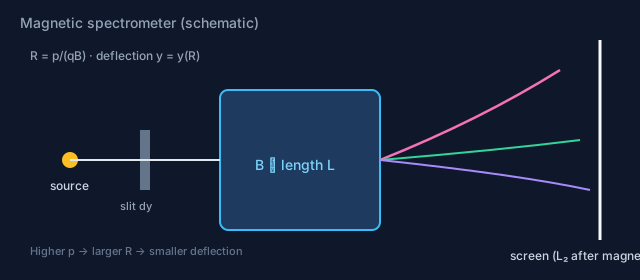
For a point-like source, the differential spectrum follows from the measured line density on the screen: \[ \frac{\mathrm{d}^3 N}{\mathrm{d}\Omega\,\mathrm{d}E_k}(E_k) \approx \frac{1}{\Delta\Omega}\, \frac{\mathrm{d}N}{\mathrm{d}y}\big|_{y(E_k)}\, \frac{\mathrm{d}y}{\mathrm{d}E_k}(E_k). \] Deriving \(y(E_k)\) and \(\mathrm{d}y/\mathrm{d}E_k\) (relativistic \(p(E_k)\)) is the heart of Exercise 10.
\(q/m\) degeneracy — filters as a first workaround. A magnet alone measures magnetic rigidity \(p/q\). A proton and a fully stripped carbon ion with the same \(p/q\) land on the same spot. A pragmatic fix is a filter stack of known thickness: ions of different \(Z\) and \(A\) lose energy at different rates (Bethe–Bloch, §4), so one species may still reach the detector while the other is stopped. The same physics underlies CR-39 pit size after Thomson spectroscopy (§3–4).
3. Thomson parabola spectrometer
Place electric and magnetic fields parallel (both transverse to the beam). In a crude non-relativistic picture with transit time \(t\approx L/v\) through a field region of length \(L\), \[ x \approx \tfrac12\frac{q}{m}E\,t^2 \approx \tfrac12\frac{q}{m}E\frac{L^2}{v^2}, \qquad y \approx \tfrac12\frac{q}{m}v_x B\,t \;\sim\; \tfrac12\frac{q}{m}B\frac{L^2}{v}, \] so eliminating \(v\) yields the classic parabola law \[ x = y^2 \cdot \frac{2m}{q}\,\frac{E}{B^2 L^2}. \] Each fixed charge-to-mass ratio \(q/m\) traces one parabola on the detector; energy (velocity) runs along the curve. That resolves the magnet’s species degeneracy electromagnetically. What it does not yet give is an independent handle on mass at fixed \(q/m\) from energy deposition alone — that needs stopping physics (§4).
Downstream detectors include scintillators, CMOS sensors, microchannel plates (MCP), and CR-39. Choice is a trade-off among sensitivity, dynamic range, single-shot capability, and absolute calibration.
4. Bethe–Bloch stopping, CR-39 pits, and the Bragg peak
When a fast ion moves through matter it loses kinetic energy mainly by ionizing and exciting target electrons. The mean energy loss per path length — the stopping power — is given (to leading order) by the Bethe formula \[ -\frac{\mathrm{d}E_{\mathrm{kin}}}{\mathrm{d}x} = \frac{4\pi n z^{2}}{\beta^{2}} \left(\frac{e^{2}}{4\pi\varepsilon_{0}}\right)^{2} \frac{1}{m_{e}c^{2}} \Biggl[ \ln\!\left( \frac{2 m_{e}c^{2}\beta^{2}}{I\,(1-\beta^{2})} \right) -\beta^{2} \Biggr], \] where \(\beta=v/c\) of the projectile, \(z\) its charge number, \(n\) the electron number density of the medium, and \(I\) a mean excitation energy (\(I\approx 75\,\mathrm{eV}\) for liquid water in the NIST PSTAR tables). Relating \(\beta\) to kinetic energy, \[ \beta = \sqrt{1-\frac{1}{(1+E_{\mathrm{kin}}/mc^{2})^{2}}}, \] shows that \(-\mathrm{d}E/\mathrm{d}x\) is a strong function of energy: it falls as the ion slows from relativistic speeds, then rises roughly as \(1/\beta^{2}\) toward lower energies (before the formula breaks down at the very end of the range). You will plot \(-\mathrm{d}E/\mathrm{d}x(E)\) and the corresponding Bragg curve in water in Exercise 10 (Part B), using NIST PSTAR as a reference.
Filters are just finite slabs of this process: the range \(R(E_0)=\int_0^{E_0}\mathrm{d}E\big/\bigl(-\mathrm{d}E/\mathrm{d}x\bigr)\) decides whether an ion of given species and energy punches through. That is why a foil stack behind a magnet (or on a Thomson trace) can separate protons from heavier ions even at the same rigidity.
CR-39 records the local energy deposition along the track. Chemical etching opens a pit whose size grows with the linear energy transfer (LET) \(-\mathrm{d}E/\mathrm{d}x\) near the end of the particle’s path in the plastic. Thus pit diameter is not a primary energy meter by itself — it is a stopping-power meter. Combined with a Thomson parabola you get a powerful identification scheme:
- parabola label \(\Rightarrow\) \(q/m\);
- position along the parabola \(\Rightarrow\) velocity / kinetic energy;
- pit size (and filters) \(\Rightarrow\) \(-\mathrm{d}E/\mathrm{d}x\propto z^{2}/\beta^{2}\,\ldots\) \(\Rightarrow\) mass / charge consistent with Bethe–Bloch.
Absolute particle counting comes for free after etching; CR-39 is essentially blind to photons and electrons.
Integrating the stopping power along the trajectory maps energy loss vs. \(E\) onto energy deposition vs. depth. Near the end of range \(\beta\) is small, \(-\mathrm{d}E/\mathrm{d}x\) is large, and one obtains the characteristic Bragg peak. Dose is proportional to fluence times stopping, \[ D(x) = \frac{1}{\rho}\,\Phi\,\left(-\frac{\mathrm{d}E}{\mathrm{d}x}\right)\Big|_{E(x)}, \] with \(\Phi\) the particle fluence and \(\rho\) the mass density. A monoenergetic beam gives a sharp peak; a broad laser–ion spectrum piles many peaks on top of each other — a spread-out Bragg curve. That is exactly the programme of Lecture 11 (SOBP, RCF stacks, time-resolved deposition).
5. Typical laser–ion spectra and outlook
Putting it together: a magnet or Thomson parabola plus a calibrated detector yields \(\mathrm{d}N/\mathrm{d}E\) (per solid angle). Published records and surveys (including the ALPA compilation alpa.physik.uni-muenchen.de/protons.html) show decades of progress in \(E_{\max}\), now into the \(\sim 100\,\mathrm{MeV}\) class for protons under favourable contrast and target conditions. Spectra are typically broad and roughly exponential on a log plot, terminating at a cut-off \(E_{\max}\).
For applications one rarely wants the raw divergent, poly-energetic spray. Energy selection and transport (quadrupoles, collimators) turn a broad spectrum into something closer to a beam — at the cost of particle number. Even without transport, that same spectrum, once sent into water, becomes a depth-dose distribution via Bethe–Bloch.
Red line into Lecture 11. Spectrum \(\mathrm{d}N/\mathrm{d}E\) measured today \(\xrightarrow{\text{Bethe–Bloch}}\) depth dose \(D(x)\) (spread-out Bragg) \(\xrightarrow{}\) RCF stacks and optically probed, time-resolved deposition (Lecture 11).